1.1. Volume editor
The central high-level component of Volumina is the volume editor. It comprises most of the Volumina features and can be easily incorporated in other (Qt-based) applications. The following figure shows the Qt volume editor widget:
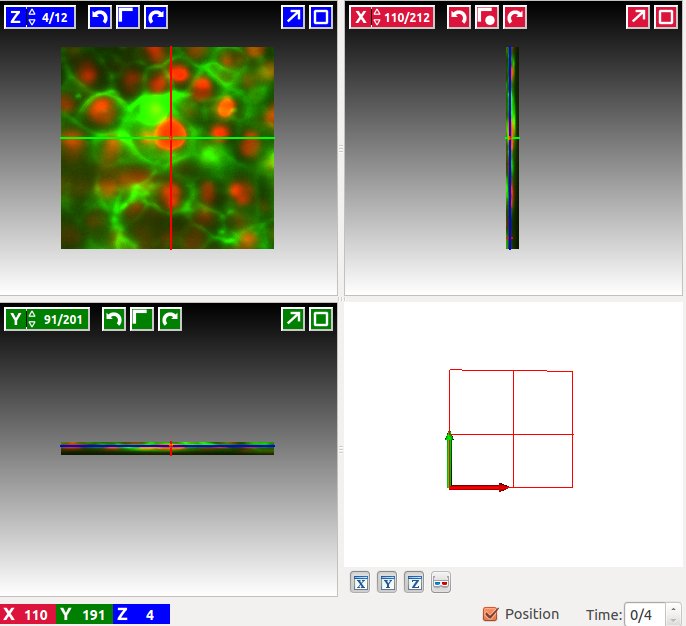
Volume editor widget. The widget shows three slicings trough the spatial axes of a three dimensional dataset with two channels rendered as a red-green composite image at time slice 0 of 4.
Other widgets are also included like a viewer for 2d images and a
layer widget that allows to control the order and appearance of
different layers in the slice views. Furthermore, a standalone viewer
application is part of Volumina, too. The viewer can be used
in a Python command prompt to inspect multidimensional datasets and
is launched with a simple view(dataset) call.
1.1.1. Code example
The following code example illustrates the central steps to display multidimensional data in several layers with Volumina:
# construct some data sources from raw data
source = ArraySource(npy_array)
rgb    = ArraySource(npy_rgbarray)

# define layers and store them in a layerstack
layerstack = LayerStackModel()

layer1 = GrayscaleLayer( source )
layer1.name = "Raw Data"
layerstack.append(layer1)

layer2 = RGBALayer(red=rgb[..., 0],
                   green=rgb[..., 1],
                   alpha=rgb[..., 2])
layer2.name = "RGB Layer"
layer2.opacity = 0.5
layerstack.append(layer1)

# instantiate a volume editor and display the layers
editor = VolumeEditor(shape, layerstack)
widget = VolumeEditorWidget( editor )
widget.show()